
Earlier this summer, in-house expert Jacqueline Dailey introduced us to Gusto, a great solution for payroll, HR, benefits, and more.
Talk to An Advisor Today
You might also like these articles
Private Equity Accounting: How to Make Your Company Attractive to Buyers
Read More
Private equity firms are sitting on close to $1.1 trillion in dry powder in the United States, and after several slower years, 2026 is shaping up as a year of real deployment. According to Cherry Bekaert’s 2026 private equity outlook, aggregate deal value crossed $1 trillion in 2025 for only the second time on record,…
Chart of Accounts Migration to Intuit Enterprise Suite: A Controller’s Guide
Read More
The chart of accounts is the spine of your financial reporting system. Get the migration right and Intuit Enterprise Suite delivers on its promise of dimensional, multi-entity, audit-ready reporting. Get it wrong and you will spend the next two years apologizing to the board for inconsistent comparatives, broken dashboards, and reports that do not tie….
Migrating from QuickBooks Online Advanced to Intuit Enterprise Suite: What Changes and What Stays
Read More
Migrating from QuickBooks Online Advanced to Intuit Enterprise Suite is one of the most common upgrade paths for growing finance teams, and Intuit makes it look almost effortless. Flip a switch, your data comes over, and you’re off to the races. That’s technically true, but it’s also where most finance teams make their first mistake….
Why Your Intuit Enterprise Suite Implementation Partner Is the Key to Success
Read More
The software is ready. The question is whether your implementation will be. Here is a tension worth naming at the start: Intuit Enterprise Suite is one of the most credible mid-market ERP platforms to arrive in a generation: cloud-native, AI-powered, multi-entity, and built on a QuickBooks foundation that most finance teams already know. And yet,…
Claim your complimentary bookeeping assesment today
Request your free bookkeeping quote today and let us simplify your financial management. Our expert team at QuickBooks is ready to tailor a solution to your needs.
July 06, 2026
Chart of Accounts Migration to Intuit Enterprise Suite: A Controller’s Guide
The chart of accounts is the spine of your financial reporting system. Get the migration right and Intuit Enterprise Suite delivers on its promise of dimensional, multi-entity, audit-ready reporting. Get it wrong and you will spend the next two years apologizing to the board for inconsistent comparatives, broken dashboards, and reports that do not tie.
Most teams default to lift-and-shift. It is the wrong default.
Your chart of accounts migration is the single best opportunity to fix structural problems that have been silently degrading your reporting for years. This guide walks through exactly how to do it: design principles, a five-step migration framework, dimension architecture, and the strategies that preserve historical comparability so your first quarterly report in Intuit Enterprise Suite does not come with a footnote.
Why the COA Migration Is the Highest-Leverage Decision in the Project
Every transaction flows through the chart of accounts. Every report, every dashboard, every integration, every audit schedule pulls from the same structure. That is not an exaggeration. It means the COA migration decision ripples into every corner of your Intuit Enterprise Suite implementation.
Mistakes are expensive to undo after go-live. A post-launch COA restructure is not just a cleanup project. It triggers reporting comparability gaps, requires re-mapping of historical data, and forces you to rebuild any dashboards or integrations that relied on the original account structure. The cost of a rebuild is typically three to five times the cost of doing it correctly the first time.
This is the one decision an implementation partner should never let a client rush. At Out of the Box Technology, we have seen it done well and we have seen it done poorly. The difference shows up within the first reporting period.
The First Principle: Do Not Lift and Shift
This is the central argument of this article, and it is worth stating plainly: do not migrate your existing chart of accounts verbatim into Intuit Enterprise Suite.
Most QuickBooks Desktop and QuickBooks Online Advanced charts of accounts have accumulated 10 to 20 or more years of additions that no longer reflect how the business actually operates. What you are looking at is a living document of every workaround, every new hire’s personal preference, and every one-off reporting request anyone ever made.
The patterns are consistent across clients. A 200-account COA where only 50 accounts have any activity in the last 12 months. Sub-accounts used to track things that dimensions should track. Revenue accounts proliferated per customer because there was no better way to slice the data. Expense accounts that are multiplied per vendor for the same reason.
None of that needs to follow you into Intuit Enterprise Suite. The migration is the cheapest time to clean it up. After go-live, every cleanup creates a reporting comparability gap that you will have to explain. Before go-live, it is just good design.
The Intuit Enterprise Suite COA Model: What Is Different
Before designing your new chart of accounts, it helps to understand what changed in the underlying architecture. Intuit Enterprise Suite is not QuickBooks with more users. The data model is meaningfully different in ways that change how a well-designed COA should look.
Native Multi-Entity Support
Intuit Enterprise Suite supports a single shared chart of accounts across multiple entities, with per-entity overrides where needed. This alone eliminates one of the most painful structural problems in multi-entity QuickBooks environments: parallel files with diverging account numbering that makes consolidated reporting a manual exercise. A well-designed Intuit Enterprise Suite COA treats the multi-entity structure from the start, not as an afterthought.
Dimensions Replace Class and Location Proliferation
In QuickBooks Desktop and QuickBooks Online Advanced, classes and locations carried most of the burden of segment reporting. The problem is that they can only stack in limited ways. Teams compensated by creating more accounts.
Intuit Enterprise Suite dimensions change the equation. You can track by region and by project and by department simultaneously, without any of that complexity landing in the chart of accounts itself. If your current COA has accounts that exist purely to slice data, those accounts are almost certainly dimension candidates in Intuit Enterprise Suite.
Account Hierarchy Depth
Intuit Enterprise Suite supports multiple levels of parent-child account hierarchy. More depth is not automatically better. The accounts that matter are the ones that reflect how your business actually generates revenue and incurs costs. Discipline in hierarchy design matters more than depth.
Calculated Fields and Business Intelligence Dimensions
Some reporting needs that previously required a new account can now be served by calculated fields or BI-level aggregations. This is another reason the lift-and-shift approach underserves the platform. An account that existed in QuickBooks to produce a specific line in a management report may not need to be an account at all in Intuit Enterprise Suite.
The Five-Step Chart of Accounts Migration Framework
Step 1: Inventory and Audit the Current COA
Pull every account in your current system with three pieces of information: last-12-month activity, current balance, and a written description of what each account is actually used for. Do not rely on account names alone. Account names in legacy systems are notoriously imprecise.
This exercise is diagnostic. Most clients discover that a significant portion of their accounts have no activity, no balance, and no clear owner. That is a signal, not a surprise.
If your team cannot produce a clear written description for every active account, that is also a signal. Undocumented accounts are accounts with unclear ownership and unclear reporting purpose. They are candidates for consolidation.
Step 2: Decide What Is a Dimension and What Is an Account
This is the most consequential design decision in the migration, and there is a reliable heuristic for making it: if you want to see it on the profit and loss statement as its own line, it is likely an account. If you want to filter or slice the P&L by it, it is likely a dimension.
Customer, project, location, department, and region are almost always dimensions in Intuit Enterprise Suite. If your current COA has accounts segmented by any of those categories, they belong in the dimension structure, not the account list.
Revenue segmented by product line or service type is typically an account question. Revenue segmented by which sales rep closed the deal is a dimension question.
Step 3: Design the Target COA
With the inventory complete and the dimension decisions made, design the target structure. This includes an account numbering scheme, a documented parent-child hierarchy, and account naming conventions that a new controller could understand without a decoder ring. Numbering conventions are customized to the business, but the principle is consistent: logical groupings with enough numeric space between ranges to accommodate future additions without forcing a full renumber.
Document everything. The decisions you make here will outlast everyone on the implementation team.
Step 4: Build the Mapping Document
Every legacy account needs a migration decision documented before a single transaction moves. There are three possible outcomes for each account: it maps to a target account, it maps to a target account plus a dimension combination, or it is sunset with no activity going forward.
No legacy account should be unmapped. An unmapped account is a decision deferred to go-live week, which is exactly when you do not want to be making COA design decisions under pressure.
The mapping document becomes the source of truth for data migration, historical data conversion, and any future audit or regulatory inquiry about why accounts changed.
Step 5: Validate Against Historical Reports
Before go-live, re-run last year’s profit and loss statement and balance sheet using the new mapping. If the totals tie and the roll-ups match the original reports, the design is sound. If they do not, you have a mapping error to debug in a controlled environment rather than a reporting discrepancy to explain after your first month close.
This validation step is non-negotiable. It is the difference between a confident go-live and a go-live with an asterisk. For a broader look at what a well-run implementation involves, see our Intuit Enterprise Suite implementation best practices guide.
Preserving Historical Comparability
The second half of getting the COA migration right is protecting the reporting comparisons your board, lenders, or auditors will expect in the first year after go-live. There are three concrete strategies.
Strategy 1: Static Historical Snapshots
Before migration, export final PDFs of your key historical reports: annual profit and loss, balance sheet, and cash flow statement for the last three years at minimum. These become your locked historical source of truth regardless of what the new system shows for prior periods.
This is not a workaround. It is standard practice for any system migration, and it gives you defensible documentation for audit purposes.
Strategy 2: Mapped Historical Data Conversion
If you are using Intuit Enterprise Suite’s data conversion tool, the mapping document from Step 4 does double duty here. Prior-period transactions should map to the new account structure so that year-over-year comparisons within the system remain valid. This requires careful validation, particularly in the first monthly close cycle.
Strategy 3: Parallel Period Running
Running one to two months in parallel between your legacy system and Intuit Enterprise Suite, then reconciling the outputs, gives you the highest confidence that the new COA produces reports that match expectations. It requires more effort, but for organizations with audit or lender scrutiny, it is often worth it.
An Honest Note on YoY Expectations
Some comparability loss is acceptable when you restructure the COA. If you consolidate 40 accounts into 12, the prior-year comparatives will look different even if the underlying numbers are identical. The right time to set that expectation with your audit committee, board, or lender is before go-live, not after the first quarterly report lands in their inbox.
Dimension Design: The Decision That Separates Good and Bad Intuit Enterprise Suite Implementations
Dimension design deserves its own section because it is where most of the analytical power of Intuit Enterprise Suite either gets realized or gets squandered.
The starting point is business strategy, not your existing class and location structure. The question is not “how do we map our current classes to dimensions?” It is “what does the business need to be able to measure and filter by to make good decisions?”
A typical starting dimension set for a mid-market business includes entity, department, location, project, and customer segment. Industry-specific additions vary depending on how the business operates and what its reporting stakeholders need to see. The dimension design for a franchise group looks different from the design for a construction company or a private equity portfolio. Getting that right from the start is one of the highest-value contributions an experienced implementation partner brings to the engagement.
Resist the urge to track everything. Every dimension you add expands reporting power and adds configuration overhead. The optimal dimension set is the one that supports the reports your CFO and board actually want, not the most comprehensive set theoretically possible.
Dimension hierarchy and parent-child relationships also matter. If your dimension structure needs to support consolidated department reporting across entities, that needs to be designed deliberately, not bolted on later.
Common Chart of Accounts Migration Mistakes
These are the patterns we see most often, and they are all avoidable.
Lifting the legacy COA verbatim. Usually justified as “keeping things familiar.” What it actually does is carry every structural problem from the old system into the new one and eliminate the primary benefit of the migration.
Using accounts where dimensions should do the work. The result is account explosion. A COA that enters the system at 150 accounts and grows to 400 within two years because every new segment gets its own account instead of its own dimension value.
Skipping the mapping document. It feels like overhead until go-live week, when every unmapped account becomes a live problem that someone has to solve under pressure.
Failing to validate the design against historical reports. The mapping exercise and the validation exercise are different. You can have a logically coherent mapping document that still produces a P&L that does not tie to history. Validate before go-live.
Underestimating opening balance reconciliation. Every account needs a validated opening balance to the penny. This is not glamorous work, and it is consistently underscoped in migration projects.
Not documenting the decisions. The next controller, the auditor two years from now, and the implementation consultant who has to troubleshoot a reporting issue in 18 months all need to understand why the COA is structured the way it is. Document the rationale, not just the structure.
Overdesigning for hypothetical complexity. Building a COA for a version of the business that does not exist yet is a common trap, especially for fast-growing companies. Design for the actual business. The COA can evolve.
How to Know Your New COA Is Right
A well-designed Intuit Enterprise Suite chart of accounts meets these criteria:
- Last full year’s reports reproduce within an acceptable tolerance using the new mapping
- Every active legacy account has a documented migration decision
- The dimension structure supports the reports your CFO and board actually want
- Account count is typically materially smaller than the legacy COA
- The full COA is documented in a single source-of-truth document that a new hire could understand in 30 minutes
If you can check all five boxes before go-live, the COA migration is in good shape.
How We Can Help
At Out of the Box Technology, we have supported more than 25,000 QuickBooks and Intuit Enterprise Suite implementations. The COA migration is the piece we are most deliberate about, because it is the piece that determines whether the rest of the implementation delivers what it promised.
If you are heading into an Intuit Enterprise Suite migration and want a second set of eyes on your COA design, we are glad to be that resource.
Ready to get your chart of accounts migration right the first time? Contact the Out of the Box Technology team, and we will walk through your current setup, flag the design decisions that matter most, and help you build a COA that works on day one and scales with your business.
Related reading:
- Why the Right Implementation Partner Is the Key to Success with Intuit Enterprise Suite
- What Is Intuit Enterprise Suite? A Guide for Growing Businesses
- Intuit Enterprise Suite New Features Spring 2026
What is the biggest mistake companies make when migrating their chart of accounts to Intuit Enterprise Suite?
The most common mistake is lift-and-shift — migrating the existing chart of accounts verbatim without reviewing or redesigning it. Most legacy QuickBooks charts of accounts have accumulated years of workarounds, inactive accounts, and structural decisions that made sense at the time but no longer reflect how the business operates. Carrying those problems into Intuit Enterprise Suite eliminates the primary benefit of the migration. The go-live window is the lowest-cost moment to fix structural issues. After go-live, every change creates a reporting comparability gap.
What is the difference between accounts and dimensions in Intuit Enterprise Suite?
A useful rule of thumb: if you want to see something as its own line on the profit and loss statement, it is likely an account. If you want to filter or slice the P&L by it, it is likely a dimension. Customer, project, location, department, and region are almost always dimensions in Intuit Enterprise Suite. One of the most common COA design mistakes is using accounts to do the work that dimensions should do — which causes account counts to grow uncontrollably over time. Intuit Enterprise Suite supports up to 20 custom dimensions, each with unlimited values and up to five levels of hierarchy.
How do I preserve historical reporting comparability after a chart of accounts redesign?
There are three strategies. First, export final PDFs of your key historical reports — annual P&L, balance sheet, and cash flow for the last three years at minimum — before migration. These become your locked historical source of truth. Second, use Intuit Enterprise Suite’s data conversion tool to map prior-period transactions to the new account structure so year-over-year comparisons remain valid in-system. Third, run one to two months in parallel between your legacy system and Intuit Enterprise Suite and reconcile the outputs before full cutover. Some comparability loss is expected when you restructure — the key is setting that expectation with your board, auditors, or lenders before go-live, not after the first quarterly report.
How many accounts should a well-designed Intuit Enterprise Suite chart of accounts have?
There is no universal target, but a well-designed Intuit Enterprise Suite COA is typically materially smaller than the legacy chart of accounts it replaces. Most migration projects that shift tracking work from accounts to dimensions see significant account reduction. The right number is whatever accurately reflects how your business generates revenue and incurs costs — no more. Accounts that exist purely to slice data by customer, project, or location are almost always better handled as dimensions.
Do I need a mapping document for a chart of accounts migration?
Yes, and skipping it is one of the most common mistakes in COA migrations. Every legacy account needs a documented decision before go-live: does it map to a target account, to a target account plus a dimension combination, or is it being sunset? An unmapped account is a decision deferred to go-live week, which is exactly when you do not want to be making COA design calls under pressure. The mapping document also becomes the source of truth for data conversion, historical reporting, and any future audit inquiry about why account structures changed.
How long does a chart of accounts migration to Intuit Enterprise Suite take?
The technical migration itself can move quickly, but a thorough COA redesign — including audit, dimension design, mapping, and historical validation — typically requires meaningful upfront investment before a single transaction moves. The scope depends on the complexity of the legacy COA, the number of entities, and how much structural cleanup is needed. Single-entity migrations with a clean starting point move faster. Multi-entity scenarios, private equity portfolios, and businesses with significant historical reporting requirements take longer. Our team can give you a realistic scope estimate after a review of your current system. Talk to an Out of the Box Technology specialist to get started.
Does the chart of accounts migration differ for construction companies or franchise groups?
Yes. Industry-specific reporting requirements meaningfully shape COA and dimension design. Construction companies typically need job-level cost tracking, work-in-progress accounting, and project profitability reporting built into the structure from the start. Franchise groups need dimension architecture that supports both franchisee-level and consolidated reporting across entities. Private equity portfolios require a COA that holds up across portfolio companies and supports investor-grade reporting. A generic COA design does not serve these needs well. Out of the Box Technology works across all three of these verticals and designs COA structures specific to how each business actually operates.
Talk to An Advisor Today
You might also like these articles
Private Equity Accounting: How to Make Your Company Attractive to Buyers
Read More
Private equity firms are sitting on close to $1.1 trillion in dry powder in the United States, and after several slower years, 2026 is shaping up as a year of real deployment. According to Cherry Bekaert’s 2026 private equity outlook, aggregate deal value crossed $1 trillion in 2025 for only the second time on record,…
Migrating from QuickBooks Online Advanced to Intuit Enterprise Suite: What Changes and What Stays
Read More
Migrating from QuickBooks Online Advanced to Intuit Enterprise Suite is one of the most common upgrade paths for growing finance teams, and Intuit makes it look almost effortless. Flip a switch, your data comes over, and you’re off to the races. That’s technically true, but it’s also where most finance teams make their first mistake….
Why Your Intuit Enterprise Suite Implementation Partner Is the Key to Success
Read More
The software is ready. The question is whether your implementation will be. Here is a tension worth naming at the start: Intuit Enterprise Suite is one of the most credible mid-market ERP platforms to arrive in a generation: cloud-native, AI-powered, multi-entity, and built on a QuickBooks foundation that most finance teams already know. And yet,…
Intuit Enterprise Suite New Features: Everything You Need to Know, Spring 2026
Read More
On May 13, 2026, Intuit announced the Spring 2026 release of Intuit Enterprise Suite — the platform’s most significant update yet. New features include automated multi-entity close workflows, dimensional reporting with peer benchmarking, expanded construction capabilities, integrated Human Capital Management, and enhanced AI agents. This guide covers every major Spring 2026 Intuit Enterprise Suite new…
Claim your complimentary bookeeping assesment today
Request your free bookkeeping quote today and let us simplify your financial management. Our expert team at QuickBooks is ready to tailor a solution to your needs.
June 03, 2026
Why Your Intuit Enterprise Suite Implementation Partner Is the Key to Success
The software is ready. The question is whether your implementation will be.
Here is a tension worth naming at the start: Intuit Enterprise Suite is one of the most credible mid-market ERP platforms to arrive in a generation: cloud-native, AI-powered, multi-entity, and built on a QuickBooks foundation that most finance teams already know. And yet, ERP implementations still fail to meet their original objectives at a rate of 55–75%, depending on who’s measuring. Gartner puts the figure at roughly 70%.
Software did not create that gap. Implementation did.
The variable that decides which side of that statistic your organization lands on is not the product you buy. It is the partner you choose to implement it.
Intuit Enterprise Suite Has Changed the Mid-Market ERP Equation
For the better part of two decades, mid-market finance teams faced a genuine “missing middle” problem. QuickBooks was too thin for a multi-entity business running real complexity. NetSuite and Sage Intacct delivered real power, but also 12-month implementation timelines, six-figure consulting fees, and a steep adoption curve that often erased whatever efficiency gains were promised.
What IES actually delivers
Intuit Enterprise Suite, launched in September 2024, was built specifically to fill that gap. It is cloud-native, AI-native, and designed for businesses that have genuinely outgrown QuickBooks Online Advanced: multi-entity consolidation, dimensional reporting, project-level job costing, integrated payroll and HR, and an AI agent layer that handles reconciliation, bank feed categorization, and expense allocation.
A commissioned Forrester study projects up to 299% ROI over three years for IES customers. The February 2026 launch of the Intuit ENt Construction Edition, Intuit’s first industry-specific ERP vertical, and the Spring 2026 release wave (multi-entity close automation, dimensional reporting enhancements, expanded HCM capabilities) signal that Intuit is investing aggressively in the platform.
Why this matters now
The “missing middle” finally has a real option. For a $20M construction company, a PE-backed home services platform, or a founder-led business running three QuickBooks files and a folder full of Excel consolidations, Intuit Enterprise Suite is no longer a compromise , it is a genuine upgrade path.
Intuit reports that 95% of Intuit Enterprise Suite customers complete migration in under 30 days. That is a meaningful number. It is also a floor, not a ceiling, and the distinction matters more than most buyers realize.
But the Software Alone Doesn’t Guarantee the Outcome
Speed without design quality is technical debt deferred, not value created.
The three causes of ERP implementation failure, consistently identified across Panorama Consulting’s annual research, are: inadequate organizational change management, poor data quality and migration, and inexperienced implementation teams. All three are fully within a partner’s control. None of them are software problems.
For most mid-market buyers, the picture is familiar:
- Years of QuickBooks workarounds have created duplicate vendors, misclassified chart of accounts entries, and stale balances. Migration surfaces every shortcut ever taken.
- The finance team is running the close; they are not learning a new ERP on the side.
- IES is new enough that experienced practitioners are genuinely scarce. An ERP partner with NetSuite or Sage Intacct certifications is not automatically qualified for IES.
- Multi-entity complexity, PE rollup structures, and integration sprawl (payroll, AP automation, sales tax, field-service platforms) mean the ERP is only as good as the architecture around it.
A technically clean go-live that hasn’t addressed any of those realities is not a success. It is a setup for a second engagement.
The Six Phases of a Well-Run Intuit Enterprise Suite Implementation
A successful implementation is not a single project with a go-live date. It is a sequence, and the same team should carry it from start to finish.
What a True Implementation Partner Does Differently
There is a meaningful difference between a partner who configures a system and a partner who designs one. The difference shows up at your first quarterly close.
1. Design before configuration
The chart of accounts, dimension structure, entity hierarchy, and reporting model should be architected before anyone touches the system. A well-designed COA built around how your business actually operates (by project, location, department, and entity) makes every future report, audit, and acquisition integration dramatically easier. The reverse approach, configuring first and fitting the business to the system later, is the most common implementation failure mode.
2. Field-level integration, not “connectors that work”
“The integration works” is not the same as “the data is trustworthy.” A serious integration engagement maps field-by-field, tests edge cases (partial shipments, credit memos, multi-entity intercompany transactions), and validates outputs against known results before the system is live. Connectors that pass end-to-end testing in isolation often break in production when real transaction volume hits unusual paths.
3. Full-cycle user acceptance testing
Testing features is not the same as testing your business. A full UAT engagement runs order-to-cash and procure-to-pay as complete cycles, from the first touchpoint to the financial statement. It surfaces the gaps between what the system does and what your team actually does, before those gaps become month-end surprises.
4. A cutover runbook with assigned owners
The go-live weekend should be the most boring weekend of the project. That requires a step-by-step cutover runbook: dry runs completed, tasks assigned by name (not by role), parallel processing logic defined, rollback criteria documented. The organizations that experience dramatic go-lives are usually the ones that skipped the dry run.
5. Hypercare that earns the name
Hypercare is not a ticketing queue. Real hypercare means daily standups in the first two weeks, explicit support through the first month-end close, and a formal knowledge transfer process before the engagement winds down. The first close on a new system is when the gaps between training and reality become visible. A partner who is present for that close has a fundamentally different relationship with the outcome than one who hands over documentation and opens a support ticket portal.
6. AI agent configuration
Intuit Enterprise Suite Accounting, Payments, Finance, and Project Management agents are genuinely capable, but they require workflow-specific configuration to deliver value. Default agent settings are generic. A partner who understands how your business actually processes invoices, expenses, and bank feeds can configure agents to return real hours to your finance team. This is increasingly the differentiator as the IES agent surface area expands.
The Six Phases of a Well-Run Intuit Enterprise Suite Implementation
A successful implementation is not a single project with a go-live date. It is a sequence — and the same team should carry it from start to finish.
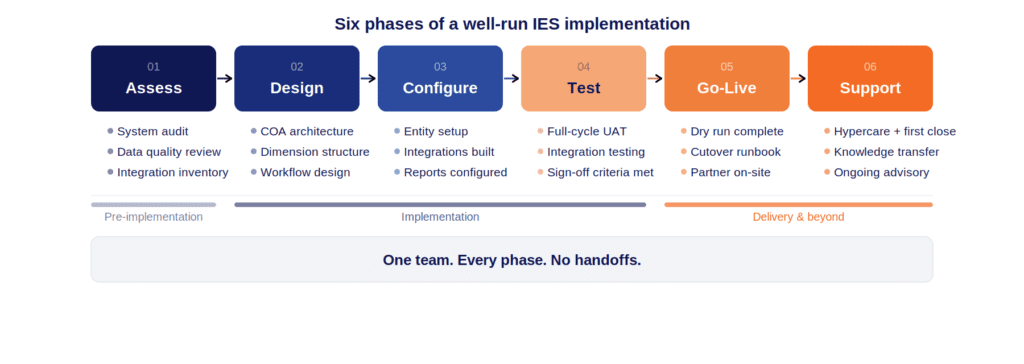
Assess — Current system audit, data quality review, integration inventory, and entity mapping. The output is a clear picture of where you are and what the migration will require. Surprises here are features, not bugs: a thorough assessment prevents worse surprises later.
Design — COA architecture, dimension structure, reporting model, workflow design, and integration specifications are documented before any configuration begins. The Configuration Design Document produced here is the reference point for every subsequent decision.
Configure — System build against the approved design. Entity structure, user roles, permissions, workflow rules, integration connections, and custom report templates.
Test — Full-cycle UAT against real business scenarios. Integration testing end-to-end. Performance validation. Issue log and resolution. Sign-off criteria met before proceeding.
Go-Live — Dry run completed. Cutover runbook executed. Parallel processing managed. Your team is running live on IES with dedicated partner support present.
Support — Hypercare through the first close. Formal knowledge transfer. Transition to ongoing advisory or controller/CFO-level support as needed.
No handoffs between phases. No sales-to-delivery-to-support relay races. One team, every step.
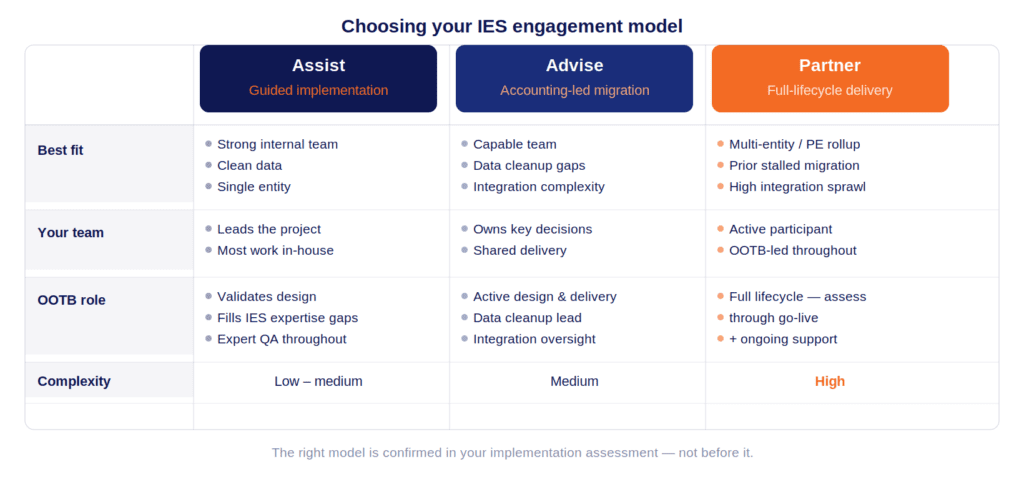
Choosing the Right Engagement Model for Your Situation
Not every Intuit Enterprise Suite migration is the same complexity — and the right engagement model depends on what you are bringing to the table.
Industry Matters: Why a Specialist Beats a Generalist
A general-purpose ERP implementer can configure a chart of accounts. They cannot necessarily design one for a construction contractor that needs certified payroll, WIP reporting against percentage-of-completion, AIA-style billing, job cost variance analysis, and retention tracking.
Construction — IES now includes the Construction Edition, with dedicated job costing, WIP reporting, AIA invoicing, and an AI-powered Project Management Agent. Implementing it correctly requires understanding the accounting — how costs flow from labor and equipment to job cost codes, how WIP schedules are produced, how over/under billings are recognized. An implementation partner who has served contractors knows this before the first design meeting.
Home and commercial services — Field-service-to-accounting integration is where margin visibility lives or dies for a services business. Technician-level profitability, dispatch-to-invoice reconciliation, fleet cost allocation — these are accounting design questions, not just technical integration questions. Intuit Enterprise Suite’s project management and job costing capabilities are purpose-built for this, but only if they are configured by someone who understands how a services business actually operates.
Private equity and multi-entity portfolios — The value of IES for a PE portfolio company or roll-up is consolidated reporting on demand, a standardized COA across entities, and the ability to absorb a new acquisition without rebuilding the finance stack. Delivering that requires intercompany elimination account design, dimension standardization across entities, and investor-grade reporting templates built from day one. Read how Intuit Enterprise Suite enables multi-entity consolidation here.
How to Evaluate an Intuit Enterprise Suite Implementation Partner: A Buyer’s Checklist
Before you select a partner, these are the questions worth asking, and pressing on if the answers are vague.
On design and methodology
- Do they design the COA and dimension architecture before configuration begins — or do they configure and adapt?
- Can they show you a sanitized Configuration Design Document from a prior engagement?
- What does their cutover runbook look like? Can they walk you through a real example?
On expertise and continuity
- Who is the named advisor on this engagement, and is that person delivering, not just selling?
- Do they have IES-specific implementation experience, or are they treating it like a prior ERP they know better?
- Do they have accounting expertise in-house, or primarily systems integration?
On hypercare and post-go-live
- What does hypercare include, specifically? Daily standups? First-close support? Or a support ticket queue?
- Can they provide controller- or CFO-level advisory support after go-live if your needs evolve?
On industry and references
- Do they have clients in your specific industry, not just finance clients generally?
- Can they provide references willing to speak about the first close after go-live?
The answers to these questions separate partners who have done this from partners who will use your implementation to learn.
The Real Measure of Success
Go-live is not success. Go-live is the beginning of the real work.
The genuine measures of a successful Intuit Enterprise Suite implementation show up later: the first quarterly close that runs in five days instead of fifteen. The first audit where the finance package comes out of the system rather than being reconstructed for auditors. The first lender reporting package that goes out on day three of the month. The first acquisition where the new entity is consolidated within weeks, not quarters.
Intuit Enterprise Suite creates the conditions for those outcomes. A skilled implementation partner closes the gap between the software’s potential and your organization’s reality.
The organizations that experience a stalled migration, a costly second engagement, or a system the finance team doesn’t trust, almost always made the same mistake: they treated implementation as a technical problem when it is actually an accounting and organizational design problem.
Choose the partner who optimizes for your first clean close, not for the shortest possible go-live date.
Ready to Assess Your Intuit Enterprise Suite Implementation?
Out of the Box Technology has completed 25,000+ migrations across QuickBooks Desktop, QBO Advanced, NetSuite, Sage, Dynamics, and SAP — with a team of 60+ US-based professionals and 35+ years in business. Our Intuit Enterprise Suite engagements are led by accounting professionals, not systems integrators.
Schedule a 30-minute Intuit Enterprise Suite Implementation Assessment.
One conversation, no obligation. We’ll review your current system, data quality, and integration landscape and tell you honestly which engagement model fits, or whether there’s preparation work to do first. A written proposal with scope, timeline, and fees follows within one week.
Start the conversation →
Related reading:
- What Is Intuit Enterprise Suite? A Guide for Growing Businesses
- Intuit Enterprise Suite Spring 2026 Features
- Streamlining Multi-Entity Accounting with IES
- How IES Transforms Project Management and Job Costing
- IES Fall 2025 Update: AI Agents & Multi-Entity Tools
Frequently asked questions
An IES implementation partner manages the full migration process — from auditing your current system and designing your chart of accounts and dimension structure, to configuring the platform, testing it against real business cycles, and supporting your team through go-live and the first month-end close. The best partners bring accounting expertise, not just technical setup, so the system is designed around how your finance team actually operates.
Intuit reports that 95% of IES customers complete migration in under 30 days. However, timeline depends on data complexity, number of entities, integration requirements, and the quality of your existing chart of accounts. A single-entity migration with clean data can go live faster; a multi-entity PE rollup with integration sprawl will take longer. A qualified implementation partner will give you a realistic timeline after an initial assessment — not before it.
Technically yes — but the data consistently shows that ERP implementations without experienced partners fail to meet their objectives at a rate of 55–75%. The risks are highest around data migration quality, chart of accounts design, and integration reliability. For a single-entity business with a small, clean QuickBooks file, an in-house attempt may be reasonable. For anything more complex — multiple entities, active integrations, or a history of accounting workarounds — the cost of a second corrective engagement typically exceeds the cost of getting it right the first time.
Intuit Enterprise Suite is a separate, more powerful platform built for businesses that have outgrown QuickBooks Online Advanced. It adds true multi-entity consolidation, dimensional reporting, integrated payroll and HR, project-level job costing, and an AI agent layer — all in a single system. It runs on the same familiar QuickBooks foundation, so the learning curve is significantly smaller than switching to a traditional ERP like NetSuite or Sage Intacct.
The most important questions to ask are: Do they design the chart of accounts and dimension structure before configuring the system? Is the named advisor on your engagement the person actually delivering — not just selling? Do they have IES-specific migration experience? What does their cutover runbook look like? What does hypercare include beyond go-live — daily standups and first-close support, or just a ticket queue? And do they have references in your specific industry?
Implementation costs vary based on entity count, data complexity, integration requirements, and the engagement model you choose. At Out of the Box Technology, we offer three tiers — Assist, Advise, and Partner — scaled to your situation. We provide a written proposal with scope, timeline, and fees within one week of your initial assessment. Schedule a 30-minute IES Implementation Assessment to get an honest picture of what your migration will require.
Talk to An Advisor Today
You might also like these articles
Private Equity Accounting: How to Make Your Company Attractive to Buyers
Read More
Private equity firms are sitting on close to $1.1 trillion in dry powder in the United States, and after several slower years, 2026 is shaping up as a year of real deployment. According to Cherry Bekaert’s 2026 private equity outlook, aggregate deal value crossed $1 trillion in 2025 for only the second time on record,…
Chart of Accounts Migration to Intuit Enterprise Suite: A Controller’s Guide
Read More
The chart of accounts is the spine of your financial reporting system. Get the migration right and Intuit Enterprise Suite delivers on its promise of dimensional, multi-entity, audit-ready reporting. Get it wrong and you will spend the next two years apologizing to the board for inconsistent comparatives, broken dashboards, and reports that do not tie….
Migrating from QuickBooks Online Advanced to Intuit Enterprise Suite: What Changes and What Stays
Read More
Migrating from QuickBooks Online Advanced to Intuit Enterprise Suite is one of the most common upgrade paths for growing finance teams, and Intuit makes it look almost effortless. Flip a switch, your data comes over, and you’re off to the races. That’s technically true, but it’s also where most finance teams make their first mistake….
Intuit Enterprise Suite New Features: Everything You Need to Know, Spring 2026
Read More
On May 13, 2026, Intuit announced the Spring 2026 release of Intuit Enterprise Suite — the platform’s most significant update yet. New features include automated multi-entity close workflows, dimensional reporting with peer benchmarking, expanded construction capabilities, integrated Human Capital Management, and enhanced AI agents. This guide covers every major Spring 2026 Intuit Enterprise Suite new…
Claim your complimentary bookeeping assesment today
Request your free bookkeeping quote today and let us simplify your financial management. Our expert team at QuickBooks is ready to tailor a solution to your needs.
May 15, 2026
Intuit Enterprise Suite New Features: Everything You Need to Know, Spring 2026
On May 13, 2026, Intuit announced the Spring 2026 release of Intuit Enterprise Suite — the platform’s most significant update yet. New features include automated multi-entity close workflows, dimensional reporting with peer benchmarking, expanded construction capabilities, integrated Human Capital Management, and enhanced AI agents. This guide covers every major Spring 2026 Intuit Enterprise Suite new feature and, more importantly, what each one means for your business.
What Is Intuit Enterprise Suite?
Intuit Enterprise Suite (IES) is Intuit’s AI-native ERP platform designed for mid-market businesses in the $5M–$250M revenue range. It brings together financial management, multi-entity accounting, payroll, project profitability, business intelligence, payments, bill pay, and — as of 2026 — Human Capital Management, all in a single cloud-based platform.
Traditional ERPs require lengthy implementations, expensive consultants, and dedicated IT teams. IES, by contrast, builds on the same foundation as QuickBooks. As a result, 90% of customers complete their migration in under 30 days. Total cost of ownership is lower, and the platform scales as the business grows.
The platform is capable of managing 200+ entities and millions in revenue, making it a legitimate enterprise-grade solution without the enterprise-grade headaches.
For accounting firms, IES is more than a software recommendation — it’s a service opportunity. A commissioned Forrester TEI study found that deploying IES with clients delivers a projected 299% ROI for accounting firms, driven by time savings in bookkeeping, reporting, and multi-entity management.
Why the Intuit Enterprise Suite Spring 2026 Updates Matter For Your Business
Here’s what’s driving Intuit’s pace of innovation: mid-market businesses are hitting a wall. They’ve outgrown QuickBooks Online Advanced. Yet, they can’t justify the cost or the 6–18 month implementation timelines of legacy ERPs like NetSuite, Sage Intacct, or Microsoft Dynamics.
The Spring 2026 Intuit Enterprise Suite new features are organized around four core themes:
- Automation — eliminating manual processes that don’t need human involvement
- Visibility — giving finance leaders real-time, decision-grade data at every level of the business
- Scalability — building for multi-entity, multi-location, multi-industry complexity
- Integration — connecting financial, operational, and workforce data in one place
Let’s dig into each major area.
1. Multi-Entity Close Automation: Closing the Books Without the Chaos
If there’s one area where growing businesses consistently lose time, it’s month-end close — especially across multiple entities. Manual intercompany reconciliations, journal entries that have to be created and mirrored in multiple books, and consolidation reports built in spreadsheets that are out of date before they’re finished. It’s a process that was designed for a different era.
The Spring 2026 Intuit Enterprise Suite new features for multi-entity close represent the most meaningful step forward in this area.
Automated Cross-Entity Accounting Workflows
IES now automatically generates and tracks intercompany eliminations at the transaction level. Instead of waiting until period-end to calculate and enter eliminations manually, the system handles this in real time. Teams can also bulk-import journal entries from spreadsheets. As a result, the time needed to finalize consolidated financials drops dramatically.
The value: Finance teams that previously spent 3–5 days on intercompany reconciliation at month-end are seeing that compressed to hours.
Multi-Level Entity Hierarchy and Consolidation
Every multi-entity business has a different structure. Legal entities, tax entities, and operational groupings rarely align perfectly. Because of this, IES now supports customizable multi-level entity hierarchies.
The value: CFOs and controllers get consolidated financial statements that reflect how the business actually operates, not just how it’s legally organized.
AI-Powered Auto-Categorization for Intercompany Sales
When one entity sells to another, the resulting bills need to be categorized correctly in both books. IES now uses AI to automatically suggest and pre-populate categories on intercompany bills based on prior transaction behavior. Users still review and approve before anything is finalized, but the bulk of the cognitive work is handled automatically.
The value: Reduced reliance on experienced accountants for routine categorization, meaning work can be distributed more broadly across the team.
Cross-Company Bill Pay
One of the most practical Spring 2026 new features: IES now allows payment of bills across any entity bank account, automatically creating the corresponding intercompany journal entries in the appropriate entities. Pay from entity A, IES handles the accounting entries in both A and B. No manual journal entries. No reconciliation backlogs.
Emily Most, VP of Finance and Administration at Certified Industrial Partners, described the impact directly: her team saves roughly 10 hours per week from the intercompany transaction features alone — and because the process no longer requires deep accounting expertise, it’s been successfully delegated to additional team members.
Josh Daneshforooz, CEO of Lango — a company that made six acquisitions in 18 months — summed it up: with IES, every new business integrates seamlessly, with no system migrations and no disruption.
2. Dimensional Reporting and Peer Benchmarking: See Your Business Clearly
A faster close is only valuable if the reports on the other side are actually useful. The Spring 2026 Intuit Enterprise Suite new features for reporting are designed to give finance leaders the kind of visibility they’ve historically had to build in Excel or pay a BI consultant to create.
Enhanced Reporting with Dimensions
IES now supports grouping and filtering report columns by dimensions across both financial and sales reports. Dimensions allow businesses to tag transactions with meaningful business context — department, location, project, product line, cost center — and then slice financial data by those tags in any report.
The result: a P&L that shows not just total company performance, but performance by region, by product line, or by business unit — without maintaining separate entity books for each view.
The value: Finance leaders get the segmented reporting they need to identify which parts of the business are driving growth and which are dragging on profitability, all from a single report.
Dimension Defaults for Customers, Vendors, and Projects
Setting dimensions on every transaction manually is tedious and error-prone. IES now allows users to define default dimensions at the customer, vendor, and project level — so every transaction tied to that record is automatically tagged correctly, without any manual effort.
The value: Cleaner, more consistent data across reports, with less time spent on data entry and cleanup.
Peer Benchmarking: How Does Your Business Stack Up?
This is one of the most genuinely exciting Intuit Enterprise Suite new features in the Spring 2026 release. IES now surfaces peer benchmarking data. Specifically, it shows how a business compares against industry peers by revenue band and location. The data comes from millions of real businesses on the Intuit platform.
For a business owner, this answers questions like: Is our gross margin healthy for a manufacturing company our size? Are our operating expenses in line with what similar businesses spend? Are we growing faster or slower than our peers?
For an accounting firm advisor, this is as much a client conversation tool as it is a reporting feature. The ability to show a client concrete, data-backed benchmarks — not general industry statistics, but data from businesses with similar revenue and geography — is genuinely differentiated.
The value: Finance leaders and advisors move from reporting on what happened to understanding what it means — and what action to take.
Brandon Webster, Director of Finance at PULSEROLLER, captured this well: IES allows his team to drill down so that ownership can see a true snapshot of overall company performance, with real visibility into which business lines are genuinely profitable versus where R&D spend is going.
3. Expanded Construction Edition: Built for How Construction Actually Works
The Construction Edition launched in beta with the February 2026 release. The Spring 2026 update significantly deepens those capabilities with new features specifically designed to improve real-time financial visibility across a job’s lifecycle.
Expanded Project Management Agent
The AI-powered Project Management Agent now provides cost recommendations that help teams identify potential gaps between estimates and actuals before those gaps become margin problems. Rather than discovering a cost overrun at project completion, finance teams can see warning signals as the project progresses — with AI flagging costs that fall outside expected ranges based on historical data.
The value: Proactive margin protection instead of reactive damage control.
Expanded Work In Progress (WIP) Reports
WIP reporting is the cornerstone of construction financial management — lenders require it, and it’s the clearest indicator of overall project financial health. The Spring 2026 update adds industry-standard WIP report fields and automated calculations, giving construction finance leaders deeper real-time job profitability visibility.
The value: Lender-ready WIP reports with the right fields and calculations, generated automatically.
New Flexible Job Costing
Moving from bid to project execution has traditionally required manually recreating cost structures in new formats. IES now supports a more detailed job costing approach that preserves data and structure from the bid phase through execution — without data loss or manual rework.
The value: Continuous financial continuity from pre-construction through project close, with no gaps in the data trail.
Scott Franchini, Partner at RedHammer (a firm specializing in construction accounting), put it directly: the biggest roadblock for a construction CFO has always been visibility. With IES, finance leaders can see budgets, actuals versus budget, billings, and gross profit on a specific project — in real time, not after the fact.
The Construction Edition remains available in beta at no additional cost for eligible IES construction customers.
4. Human Capital Management: Workforce and Financials, Finally Together
One of the most operationally significant Spring 2026 Intuit Enterprise Suite new features is the full integration of QuickBooks Workforce — Intuit’s newly launched HCM solution — directly into the IES platform.
For the first time, mid-market businesses can manage their complete workforce operations on the same platform as their financials: payroll, time tracking, benefits, hiring, recruiting, and performance management all in one place.
Why This Matters
Running HR and finance on separate platforms creates a cascade of operational problems. Data doesn’t sync cleanly. Payroll entries must be pushed to the general ledger manually. Headcount data often doesn’t match financial projections. On top of that, budget variance analysis requires pulling data from multiple systems and reconciling by hand.
By unifying HCM and financials on a single platform, IES gives finance leaders a true 360-degree view of business performance — one where workforce costs, headcount changes, and productivity metrics are visible alongside revenue, expenses, and cash flow in the same interface.
The value for growing businesses: Faster, more accurate payroll accounting. Headcount planning is connected to the financial model. Hiring and compensation decisions informed by real financial data. And significantly less time moving data between HR and finance systems.
The value for multi-entity businesses: A consolidated employee list across all entities, a new multi-entity payroll hub providing a unified view of payroll status across all IES entities on a single screen, and workforce visibility that spans the entire organization — not just a single legal entity.
5. AI Agent Enhancements: More Automation, Less Manual Work
Intuit’s approach to AI in Enterprise Suite is a team of purpose-built agents, each responsible for automating a specific domain of financial operations. The Spring 2026 release brings meaningful upgrades to several of these agents.
Finance Agent
The Finance Agent now delivers a customizable monthly performance summary for the entire multi-entity organization, with the ability to drill down from a parent-level consolidated view into individual entities. Finance leaders can tailor what metrics appear, how entities are grouped, and what comparison period is used — and receive it automatically, without building the report manually each month.
The value: Senior finance leaders get a consistent, comprehensive performance briefing without dedicating staff time to produce it.
Accounting Agent
The Accounting Agent scans incoming bank feed transactions, matches them to vendors and categories based on prior behavior, and groups similar matches for batch review. Rather than coding transactions one by one, accountants can review and confirm a grouped set of matched transactions in bulk.
The value: Routine transaction coding goes from a daily grind to a quick review process — freeing accounting staff for work that actually requires judgment.
Sales Tax Agent
The Sales Tax Agent now includes a pre-filing check tool that automatically scans for mismatches between the Profit & Loss report and the Sales Tax Liability report before a filing is submitted. Catching these discrepancies pre-filing rather than post-filing saves businesses from amended returns, penalties, and the stress of retrospective corrections.
The value: A built-in compliance check that protects businesses from common, preventable sales tax errors.
The Conversational Chat Interface (Beta)
A new conversational “chat” interface is now available in beta. Finance teams can interact with their data and trigger automated workflows using natural language — asking questions, requesting reports, or setting up recurring processes without navigating menus. For teams newer to the platform, this dramatically lowers the barrier to taking advantage of IES’s more sophisticated capabilities.
Who Should Use Intuit Enterprise Suite?
The Spring 2026 Intuit Enterprise Suite new features make a strong case for a specific type of business.
IES is the right fit when:
Your business manages multiple entities.
If you’re running two or more legal entities, the multi-entity close automation, intercompany eliminations, and cross-company bill pay features alone will likely pay for the platform in time saved.
You’re in construction.
The expanded Construction Edition is purpose-built for mid-market contractors who need real-time WIP reporting, flexible job costing, and AI-powered project cost monitoring — all connected to the general ledger.
You need workforce and financial data in one place.
The QuickBooks Workforce integration means payroll, headcount, and HR data are connected to financial reporting natively. No more reconciling between separate systems.
Your reporting still requires too much manual work.
If your finance team is exporting to Excel to build the reports leadership actually uses, that’s a clear signal your current platform isn’t keeping up. IES’s dimensional reporting and peer benchmarking are designed to fix that.
You’ve outgrown QuickBooks Online Advanced.
If transaction volumes are slowing your system, you’re managing multiple entities, or you need approval workflows and audit trails that QuickBooks can’t provide, IES is the natural next step — without the migration complexity of a traditional ERP.
You’re in the $5M–$250M revenue range.
Below this, QuickBooks Online or Advanced is likely sufficient. Above it, you may need capabilities that IES doesn’t yet offer. But in this range, IES hits a compelling price-to-capability ratio.
IES vs. Traditional ERPs: What’s the Real Difference?
A common question when evaluating IES: how does it compare to NetSuite, Sage Intacct, or Acumatica? Here’s an honest breakdown.
Implementation time: Traditional ERP implementations typically take 6–18 months. They also require dedicated consulting resources. In contrast, 90% of IES migrations complete in under 30 days.
Total cost of ownership: Beyond licensing, traditional ERPs carry large costs in implementation, training, customization, and maintenance. IES is cloud-native and familiar to QuickBooks users. As a result, those hidden costs drop significantly.
Ease of use: Finance teams that know QuickBooks can navigate IES with minimal training. Traditional ERPs, on the other hand, often require dedicated power users or system administrators to operate effectively.
Capability depth: Where traditional ERPs still hold advantages is in manufacturing-specific workflows, deep supply chain management, and complex multi-currency global operations. If your business has significant complexity in these areas, a traditional ERP may still be the right answer.
AI and automation: IES’s AI agents are genuinely differentiated. Most traditional ERPs are bolting AI on as an overlay; IES was built with AI-native architecture from the ground up, and the Spring 2026 enhancements deepen that advantage further.
For the typical mid-market business — multi-entity, growing fast, tired of spreadsheets, not yet needing global ERP complexity — the Spring 2026 Intuit Enterprise Suite new features make IES the most compelling option in the market.
How OOTB Can Help You Get the Most from Intuit Enterprise Suite
The Spring 2026 Intuit Enterprise Suite new features represent a genuine step change for mid-market businesses. However, feature announcements are one thing. Configuring the platform, training your team, and integrating it with existing systems is another.
At OOTB, we help businesses and accounting firms implement and optimize Intuit Enterprise Suite. Whether you’re evaluating IES for the first time, migrating from QuickBooks Desktop, or looking to unlock features you haven’t adopted yet, our team has the expertise to make it work.
Migration and Implementation
We manage the entire IES migration process — from data cleanup and chart of accounts design to entity structure setup and go-live. Most clients are up and running in under 30 days. We also configure the platform to reflect how your business actually operates, whether that means multi-entity hierarchies, cross-company bill pay, custom KPI dashboards, or the Construction Edition.
Training, Adoption, and Ongoing Support
The best platform is only as good as the team using it. We deliver hands-on training that sticks. Beyond go-live, our team stays involved — keeping you informed as IES continues to evolve and helping you take advantage of new features as they arrive. For many clients, we also handle the day-to-day accounting, so you get the platform and the people in one place.
Ready to talk through what the Spring 2026 Intuit Enterprise Suite new features mean for your business or your clients?
Reach out to the OOTB team — we’re here to help.
FAQs
The Spring 2026 Intuit Enterprise Suite new features began rolling out to all US-based IES customers on May 13, 2026. This includes multi-entity close automation, the HCM integration, expanded construction capabilities, and enhanced AI agents. If you’re already on IES, these updates are live in your platform now.
The Winter 2026 release introduced the IES Construction Edition beta, modernized reporting, calculated fields, management reports, parallel approval workflows, and expanded app integrations. We covered it in detail in our previous post on the February 2026 IES release. Together, the Winter and Spring 2026 releases represent the most comprehensive platform upgrade IES has seen.
Yes — the IES Construction Edition is currently available in beta at no additional cost for eligible customers in the construction industry. It includes job costing, WIP reporting, AIA-style invoicing, project phase tracking, and an AI-powered Project Management Agent. If you’re a contractor or construction firm evaluating IES, see how OOTB supports construction businesses.
Not exactly. Intuit Enterprise Suite is a separate, more powerful platform built for businesses that have outgrown QuickBooks Online Advanced. It handles multi-entity accounting, advanced reporting, payroll, HR, and project management in one place. It’s built on the same Intuit foundation though, so the learning curve is much smaller than switching to a traditional ERP.
Most migrations complete in under 30 days, and some clients have been up and running in as little as two hours. The timeline depends on data complexity, number of entities, and your chart of accounts. OOTB manages the entire migration process — from data cleanup and entity configuration to training and go-live — so your team experiences minimal disruption. Schedule a free consultation to get a realistic timeline for your situation.
Yes. Intuit Enterprise Suite is built to handle 200+ entities and millions in revenue. The Spring 2026 release added multi-level entity hierarchy and consolidation, so you can structure entities to reflect your actual tax, legal, and operational needs — not just a flat list.
Yes — in beta. The new AI chat interface is available for eligible IES, QuickBooks Online, and QuickBooks Online Advanced customers. It lets finance teams interact with their data using natural language, triggering reports and workflows without navigating menus.
Talk to An Advisor Today
You might also like these articles
Private Equity Accounting: How to Make Your Company Attractive to Buyers
Read More
Private equity firms are sitting on close to $1.1 trillion in dry powder in the United States, and after several slower years, 2026 is shaping up as a year of real deployment. According to Cherry Bekaert’s 2026 private equity outlook, aggregate deal value crossed $1 trillion in 2025 for only the second time on record,…
Chart of Accounts Migration to Intuit Enterprise Suite: A Controller’s Guide
Read More
The chart of accounts is the spine of your financial reporting system. Get the migration right and Intuit Enterprise Suite delivers on its promise of dimensional, multi-entity, audit-ready reporting. Get it wrong and you will spend the next two years apologizing to the board for inconsistent comparatives, broken dashboards, and reports that do not tie….
Migrating from QuickBooks Online Advanced to Intuit Enterprise Suite: What Changes and What Stays
Read More
Migrating from QuickBooks Online Advanced to Intuit Enterprise Suite is one of the most common upgrade paths for growing finance teams, and Intuit makes it look almost effortless. Flip a switch, your data comes over, and you’re off to the races. That’s technically true, but it’s also where most finance teams make their first mistake….
Why Your Intuit Enterprise Suite Implementation Partner Is the Key to Success
Read More
The software is ready. The question is whether your implementation will be. Here is a tension worth naming at the start: Intuit Enterprise Suite is one of the most credible mid-market ERP platforms to arrive in a generation: cloud-native, AI-powered, multi-entity, and built on a QuickBooks foundation that most finance teams already know. And yet,…
Claim your complimentary bookeeping assesment today
Request your free bookkeeping quote today and let us simplify your financial management. Our expert team at QuickBooks is ready to tailor a solution to your needs.