On May 13, 2026, Intuit announced the Spring 2026 release of Intuit Enterprise Suite — the platform’s most significant update yet. New features include automated multi-entity close workflows, dimensional reporting with peer benchmarking, expanded construction capabilities, integrated Human Capital Management, and enhanced AI agents. This guide covers every major Spring 2026 Intuit Enterprise Suite new feature and, more importantly, what each one means for your business.
What Is Intuit Enterprise Suite?
Intuit Enterprise Suite (IES) is Intuit’s AI-native ERP platform designed for mid-market businesses in the $5M–$250M revenue range. It brings together financial management, multi-entity accounting, payroll, project profitability, business intelligence, payments, bill pay, and — as of 2026 — Human Capital Management, all in a single cloud-based platform.
Traditional ERPs require lengthy implementations, expensive consultants, and dedicated IT teams. IES, by contrast, builds on the same foundation as QuickBooks. As a result, 90% of customers complete their migration in under 30 days. Total cost of ownership is lower, and the platform scales as the business grows.
The platform is capable of managing 200+ entities and millions in revenue, making it a legitimate enterprise-grade solution without the enterprise-grade headaches.
For accounting firms, IES is more than a software recommendation — it’s a service opportunity. A commissioned Forrester TEI study found that deploying IES with clients delivers a projected 299% ROI for accounting firms, driven by time savings in bookkeeping, reporting, and multi-entity management.
Why the Intuit Enterprise Suite Spring 2026 Updates Matter For Your Business
Here’s what’s driving Intuit’s pace of innovation: mid-market businesses are hitting a wall. They’ve outgrown QuickBooks Online Advanced. Yet, they can’t justify the cost or the 6–18 month implementation timelines of legacy ERPs like NetSuite, Sage Intacct, or Microsoft Dynamics.
The Spring 2026 Intuit Enterprise Suite new features are organized around four core themes:
- Automation — eliminating manual processes that don’t need human involvement
- Visibility — giving finance leaders real-time, decision-grade data at every level of the business
- Scalability — building for multi-entity, multi-location, multi-industry complexity
- Integration — connecting financial, operational, and workforce data in one place
Let’s dig into each major area.
1. Multi-Entity Close Automation: Closing the Books Without the Chaos
If there’s one area where growing businesses consistently lose time, it’s month-end close — especially across multiple entities. Manual intercompany reconciliations, journal entries that have to be created and mirrored in multiple books, and consolidation reports built in spreadsheets that are out of date before they’re finished. It’s a process that was designed for a different era.
The Spring 2026 Intuit Enterprise Suite new features for multi-entity close represent the most meaningful step forward in this area.
Automated Cross-Entity Accounting Workflows
IES now automatically generates and tracks intercompany eliminations at the transaction level. Instead of waiting until period-end to calculate and enter eliminations manually, the system handles this in real time. Teams can also bulk-import journal entries from spreadsheets. As a result, the time needed to finalize consolidated financials drops dramatically.
The value: Finance teams that previously spent 3–5 days on intercompany reconciliation at month-end are seeing that compressed to hours.
Multi-Level Entity Hierarchy and Consolidation
Every multi-entity business has a different structure. Legal entities, tax entities, and operational groupings rarely align perfectly. Because of this, IES now supports customizable multi-level entity hierarchies.
The value: CFOs and controllers get consolidated financial statements that reflect how the business actually operates, not just how it’s legally organized.
AI-Powered Auto-Categorization for Intercompany Sales
When one entity sells to another, the resulting bills need to be categorized correctly in both books. IES now uses AI to automatically suggest and pre-populate categories on intercompany bills based on prior transaction behavior. Users still review and approve before anything is finalized, but the bulk of the cognitive work is handled automatically.
The value: Reduced reliance on experienced accountants for routine categorization, meaning work can be distributed more broadly across the team.
Cross-Company Bill Pay
One of the most practical Spring 2026 new features: IES now allows payment of bills across any entity bank account, automatically creating the corresponding intercompany journal entries in the appropriate entities. Pay from entity A, IES handles the accounting entries in both A and B. No manual journal entries. No reconciliation backlogs.
Emily Most, VP of Finance and Administration at Certified Industrial Partners, described the impact directly: her team saves roughly 10 hours per week from the intercompany transaction features alone — and because the process no longer requires deep accounting expertise, it’s been successfully delegated to additional team members.
Josh Daneshforooz, CEO of Lango — a company that made six acquisitions in 18 months — summed it up: with IES, every new business integrates seamlessly, with no system migrations and no disruption.
2. Dimensional Reporting and Peer Benchmarking: See Your Business Clearly
A faster close is only valuable if the reports on the other side are actually useful. The Spring 2026 Intuit Enterprise Suite new features for reporting are designed to give finance leaders the kind of visibility they’ve historically had to build in Excel or pay a BI consultant to create.
Enhanced Reporting with Dimensions
IES now supports grouping and filtering report columns by dimensions across both financial and sales reports. Dimensions allow businesses to tag transactions with meaningful business context — department, location, project, product line, cost center — and then slice financial data by those tags in any report.
The result: a P&L that shows not just total company performance, but performance by region, by product line, or by business unit — without maintaining separate entity books for each view.
The value: Finance leaders get the segmented reporting they need to identify which parts of the business are driving growth and which are dragging on profitability, all from a single report.
Dimension Defaults for Customers, Vendors, and Projects
Setting dimensions on every transaction manually is tedious and error-prone. IES now allows users to define default dimensions at the customer, vendor, and project level — so every transaction tied to that record is automatically tagged correctly, without any manual effort.
The value: Cleaner, more consistent data across reports, with less time spent on data entry and cleanup.
Peer Benchmarking: How Does Your Business Stack Up?
This is one of the most genuinely exciting Intuit Enterprise Suite new features in the Spring 2026 release. IES now surfaces peer benchmarking data. Specifically, it shows how a business compares against industry peers by revenue band and location. The data comes from millions of real businesses on the Intuit platform.
For a business owner, this answers questions like: Is our gross margin healthy for a manufacturing company our size? Are our operating expenses in line with what similar businesses spend? Are we growing faster or slower than our peers?
For an accounting firm advisor, this is as much a client conversation tool as it is a reporting feature. The ability to show a client concrete, data-backed benchmarks — not general industry statistics, but data from businesses with similar revenue and geography — is genuinely differentiated.
The value: Finance leaders and advisors move from reporting on what happened to understanding what it means — and what action to take.
Brandon Webster, Director of Finance at PULSEROLLER, captured this well: IES allows his team to drill down so that ownership can see a true snapshot of overall company performance, with real visibility into which business lines are genuinely profitable versus where R&D spend is going.
3. Expanded Construction Edition: Built for How Construction Actually Works
The Construction Edition launched in beta with the February 2026 release. The Spring 2026 update significantly deepens those capabilities with new features specifically designed to improve real-time financial visibility across a job’s lifecycle.
Expanded Project Management Agent
The AI-powered Project Management Agent now provides cost recommendations that help teams identify potential gaps between estimates and actuals before those gaps become margin problems. Rather than discovering a cost overrun at project completion, finance teams can see warning signals as the project progresses — with AI flagging costs that fall outside expected ranges based on historical data.
The value: Proactive margin protection instead of reactive damage control.
Expanded Work In Progress (WIP) Reports
WIP reporting is the cornerstone of construction financial management — lenders require it, and it’s the clearest indicator of overall project financial health. The Spring 2026 update adds industry-standard WIP report fields and automated calculations, giving construction finance leaders deeper real-time job profitability visibility.
The value: Lender-ready WIP reports with the right fields and calculations, generated automatically.
New Flexible Job Costing
Moving from bid to project execution has traditionally required manually recreating cost structures in new formats. IES now supports a more detailed job costing approach that preserves data and structure from the bid phase through execution — without data loss or manual rework.
The value: Continuous financial continuity from pre-construction through project close, with no gaps in the data trail.
Scott Franchini, Partner at RedHammer (a firm specializing in construction accounting), put it directly: the biggest roadblock for a construction CFO has always been visibility. With IES, finance leaders can see budgets, actuals versus budget, billings, and gross profit on a specific project — in real time, not after the fact.
The Construction Edition remains available in beta at no additional cost for eligible IES construction customers.
4. Human Capital Management: Workforce and Financials, Finally Together
One of the most operationally significant Spring 2026 Intuit Enterprise Suite new features is the full integration of QuickBooks Workforce — Intuit’s newly launched HCM solution — directly into the IES platform.
For the first time, mid-market businesses can manage their complete workforce operations on the same platform as their financials: payroll, time tracking, benefits, hiring, recruiting, and performance management all in one place.
Why This Matters
Running HR and finance on separate platforms creates a cascade of operational problems. Data doesn’t sync cleanly. Payroll entries must be pushed to the general ledger manually. Headcount data often doesn’t match financial projections. On top of that, budget variance analysis requires pulling data from multiple systems and reconciling by hand.
By unifying HCM and financials on a single platform, IES gives finance leaders a true 360-degree view of business performance — one where workforce costs, headcount changes, and productivity metrics are visible alongside revenue, expenses, and cash flow in the same interface.
The value for growing businesses: Faster, more accurate payroll accounting. Headcount planning is connected to the financial model. Hiring and compensation decisions informed by real financial data. And significantly less time moving data between HR and finance systems.
The value for multi-entity businesses: A consolidated employee list across all entities, a new multi-entity payroll hub providing a unified view of payroll status across all IES entities on a single screen, and workforce visibility that spans the entire organization — not just a single legal entity.
5. AI Agent Enhancements: More Automation, Less Manual Work
Intuit’s approach to AI in Enterprise Suite is a team of purpose-built agents, each responsible for automating a specific domain of financial operations. The Spring 2026 release brings meaningful upgrades to several of these agents.
Finance Agent
The Finance Agent now delivers a customizable monthly performance summary for the entire multi-entity organization, with the ability to drill down from a parent-level consolidated view into individual entities. Finance leaders can tailor what metrics appear, how entities are grouped, and what comparison period is used — and receive it automatically, without building the report manually each month.
The value: Senior finance leaders get a consistent, comprehensive performance briefing without dedicating staff time to produce it.
Accounting Agent
The Accounting Agent scans incoming bank feed transactions, matches them to vendors and categories based on prior behavior, and groups similar matches for batch review. Rather than coding transactions one by one, accountants can review and confirm a grouped set of matched transactions in bulk.
The value: Routine transaction coding goes from a daily grind to a quick review process — freeing accounting staff for work that actually requires judgment.
Sales Tax Agent
The Sales Tax Agent now includes a pre-filing check tool that automatically scans for mismatches between the Profit & Loss report and the Sales Tax Liability report before a filing is submitted. Catching these discrepancies pre-filing rather than post-filing saves businesses from amended returns, penalties, and the stress of retrospective corrections.
The value: A built-in compliance check that protects businesses from common, preventable sales tax errors.
The Conversational Chat Interface (Beta)
A new conversational “chat” interface is now available in beta. Finance teams can interact with their data and trigger automated workflows using natural language — asking questions, requesting reports, or setting up recurring processes without navigating menus. For teams newer to the platform, this dramatically lowers the barrier to taking advantage of IES’s more sophisticated capabilities.
Who Should Use Intuit Enterprise Suite?
The Spring 2026 Intuit Enterprise Suite new features make a strong case for a specific type of business.
IES is the right fit when:
Your business manages multiple entities.
If you’re running two or more legal entities, the multi-entity close automation, intercompany eliminations, and cross-company bill pay features alone will likely pay for the platform in time saved.
You’re in construction.
The expanded Construction Edition is purpose-built for mid-market contractors who need real-time WIP reporting, flexible job costing, and AI-powered project cost monitoring — all connected to the general ledger.
You need workforce and financial data in one place.
The QuickBooks Workforce integration means payroll, headcount, and HR data are connected to financial reporting natively. No more reconciling between separate systems.
Your reporting still requires too much manual work.
If your finance team is exporting to Excel to build the reports leadership actually uses, that’s a clear signal your current platform isn’t keeping up. IES’s dimensional reporting and peer benchmarking are designed to fix that.
You’ve outgrown QuickBooks Online Advanced.
If transaction volumes are slowing your system, you’re managing multiple entities, or you need approval workflows and audit trails that QuickBooks can’t provide, IES is the natural next step — without the migration complexity of a traditional ERP.
You’re in the $5M–$250M revenue range.
Below this, QuickBooks Online or Advanced is likely sufficient. Above it, you may need capabilities that IES doesn’t yet offer. But in this range, IES hits a compelling price-to-capability ratio.
IES vs. Traditional ERPs: What’s the Real Difference?
A common question when evaluating IES: how does it compare to NetSuite, Sage Intacct, or Acumatica? Here’s an honest breakdown.
Implementation time: Traditional ERP implementations typically take 6–18 months. They also require dedicated consulting resources. In contrast, 90% of IES migrations complete in under 30 days.
Total cost of ownership: Beyond licensing, traditional ERPs carry large costs in implementation, training, customization, and maintenance. IES is cloud-native and familiar to QuickBooks users. As a result, those hidden costs drop significantly.
Ease of use: Finance teams that know QuickBooks can navigate IES with minimal training. Traditional ERPs, on the other hand, often require dedicated power users or system administrators to operate effectively.
Capability depth: Where traditional ERPs still hold advantages is in manufacturing-specific workflows, deep supply chain management, and complex multi-currency global operations. If your business has significant complexity in these areas, a traditional ERP may still be the right answer.
AI and automation: IES’s AI agents are genuinely differentiated. Most traditional ERPs are bolting AI on as an overlay; IES was built with AI-native architecture from the ground up, and the Spring 2026 enhancements deepen that advantage further.
For the typical mid-market business — multi-entity, growing fast, tired of spreadsheets, not yet needing global ERP complexity — the Spring 2026 Intuit Enterprise Suite new features make IES the most compelling option in the market.
How OOTB Can Help You Get the Most from Intuit Enterprise Suite
The Spring 2026 Intuit Enterprise Suite new features represent a genuine step change for mid-market businesses. However, feature announcements are one thing. Configuring the platform, training your team, and integrating it with existing systems is another.
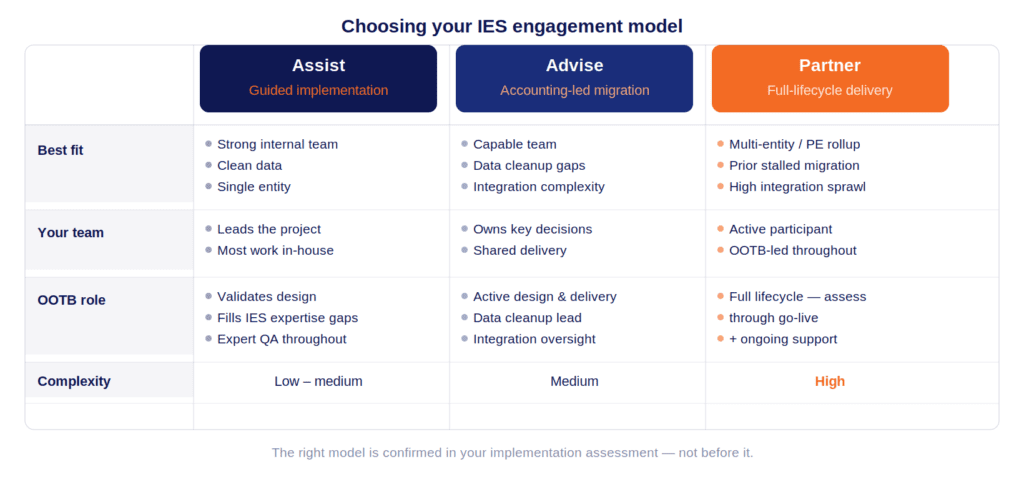
At OOTB, we help businesses and accounting firms implement and optimize Intuit Enterprise Suite. Whether you’re evaluating IES for the first time, migrating from QuickBooks Desktop, or looking to unlock features you haven’t adopted yet, our team has the expertise to make it work.
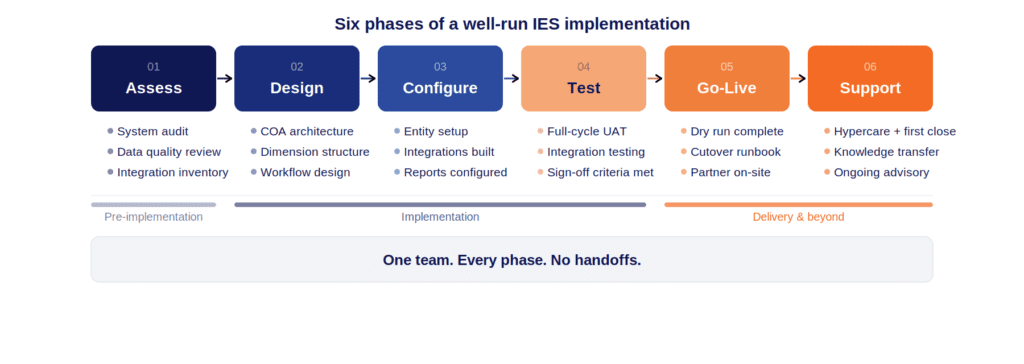
Migration and Implementation
We manage the entire IES migration process — from data cleanup and chart of accounts design to entity structure setup and go-live. Most clients are up and running in under 30 days. We also configure the platform to reflect how your business actually operates, whether that means multi-entity hierarchies, cross-company bill pay, custom KPI dashboards, or the Construction Edition.
Training, Adoption, and Ongoing Support
The best platform is only as good as the team using it. We deliver hands-on training that sticks. Beyond go-live, our team stays involved — keeping you informed as IES continues to evolve and helping you take advantage of new features as they arrive. For many clients, we also handle the day-to-day accounting, so you get the platform and the people in one place.
Ready to talk through what the Spring 2026 Intuit Enterprise Suite new features mean for your business or your clients?
FAQs